“Trading Made Simple: How to Recognize Market Trends”
UncategorizedWhile talking about trading, for starters, an understanding of market trends is highly important. It will provide you with enough information that may cause prices to rise, fall, or otherwise remain stable. Well, you’re in luck; you don’t need technical, sophisticated equipment to gain a simple glimpse of what trends look like. Here’s how you can get a sense of trends in simple, step-by-step action:
1. Three Types of Market Trends
Before venturing into the topic, you should understand the three major types of market trend:
Uptrend (Bullish Market): Prices are always moving upwards over time. The market is often termed “bullish” since investors are optimistic, and in that market, there is very high buying interest.
Down Trend (Bearish Market): Prices tend to be falling. This is referred to as a “bearish” market since it tends to suggest higher selling pressures and investor pessimism.
Sideways/Horizontal Trend: Prices move erratically in a restricted range, without one outstanding trend either upward or downward. Under these circumstances, the trend tends to show a lack of decisive market opinion.
Knowing these trends enables you to guide your trades based on the prevailing orientation of the market.

2. Simple Line Charts for Tracking Price Action
A line chart is one of the most basic ways of tracking market trends over time. Instead of confusing candlesticks or bar charts, which can be daunting for a new trader, line charts show connected closing prices over time, keeping things simple while providing a visual read on price action.
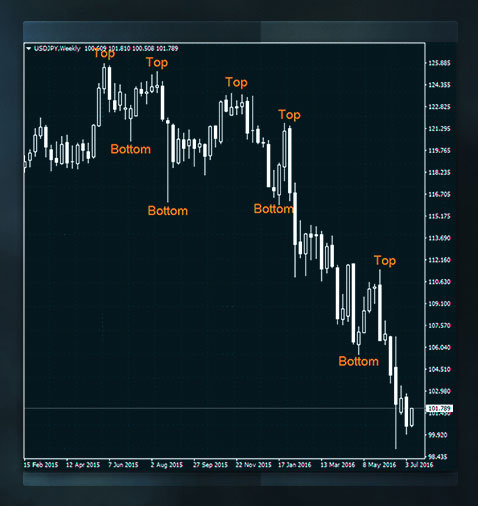
What to look for: Plot an imaginary line that best fits the tops (peaks) and bottoms (troughs) shown on the chart. If this line tends to slope upwards in general, it’s an uptrend. If it slopes downwards, it’s a downtrend. A flat line tends to be a sideways trend.
3. Higher Highs and Higher Lows
For an uptrend, the price will form higher highs – that is, new peaks- and higher lows, which are higher troughs. Downtrend is characterized by lower highs and lower lows.
How to identify: Look at a chart. Is every new high higher than the previous one? Is every new low higher than the previous one as well? This can form a regular uptrend. If both highs and lows are lower than before, then this forms a downtrend.
4. Check Moving Averages
The moving averages do not require you to use complicated tools; however, they can represent an easy way to arrive quickly at the trend. Most trading platforms and web platforms allow one easy access to basic moving averages without having to put much complexity into analysis.
Simple Moving Average: A simple moving average is calculated by averaging the price over a set number of days-for example, a 20-day or 50-day simple moving average. If the prices consistently maintain a position above that line, you can be fairly certain you are in an uptrend. Conversely, if they are below, you might be in a downtrend.
200-Day Moving Average: The 200-day moving average is another often used indicator for long-term trend analysis. In a bullish picture when prices are above the average, but it becomes bearish when below.

5. Be Aware of Volume Confirm Trend
Volume, or shares traded, tells much about the strength of a trend. The strength in an uptrend relies much on high trading volume; this tends to indicate that selling interest is rather weak. High volume in a downtrend suggests strong selling pressure.
Lagging indicator: Prices are moving upward with high volume. This tends to be a stronger signal than a price move up with low volume. Price are falling with high volume tends to be a confirming likelihood that the trend will continue to go down.
6. Pay Attention to News and Market Sentiment
Much of the trend can be driven by market sentiment. Sometimes, the prices move based on mere expectations, rather than actual data; and such movements are often termed as “sentiment-driven” movements. News and investor sentiment can aid a reader to evaluate whether or not the prices in a trend are getting influenced by factors other than the standard price and volume.
Example: Positives about the expansion of a company may be good news that pushes the stock in an upward trend, while bad news may mean a downward trend.
7. Practice Patience and Consistency
To identify trends, you need experience and there is usually a change in trends as time goes by. Do not jump into conclusions, but observe market movements repetitively and over time, which would enlighten you on how trends develop. Recording your trend observations in a simple trading journal will be a great way to track and learn from them.
Final Thoughts
Identifying simple market trend patterns is not rocket science. Observe the direction of prices, look for consistencies, and use simple moving averages and volume tools to begin seeing patterns and trends in the market. Understand that identifying trends is only one half of a great trading strategy; however, that is a good foundation to take you on your trading journey.